Morphological Graph from Overture Maps & OpenStreetMap with City2Graph
This notebook demonstrates how to create morphological graph using City2Graph and data from Overture Maps. Morphological graph provide a comprehensive graph representation of urban form that captures the relationships between public and private spaces in cities.
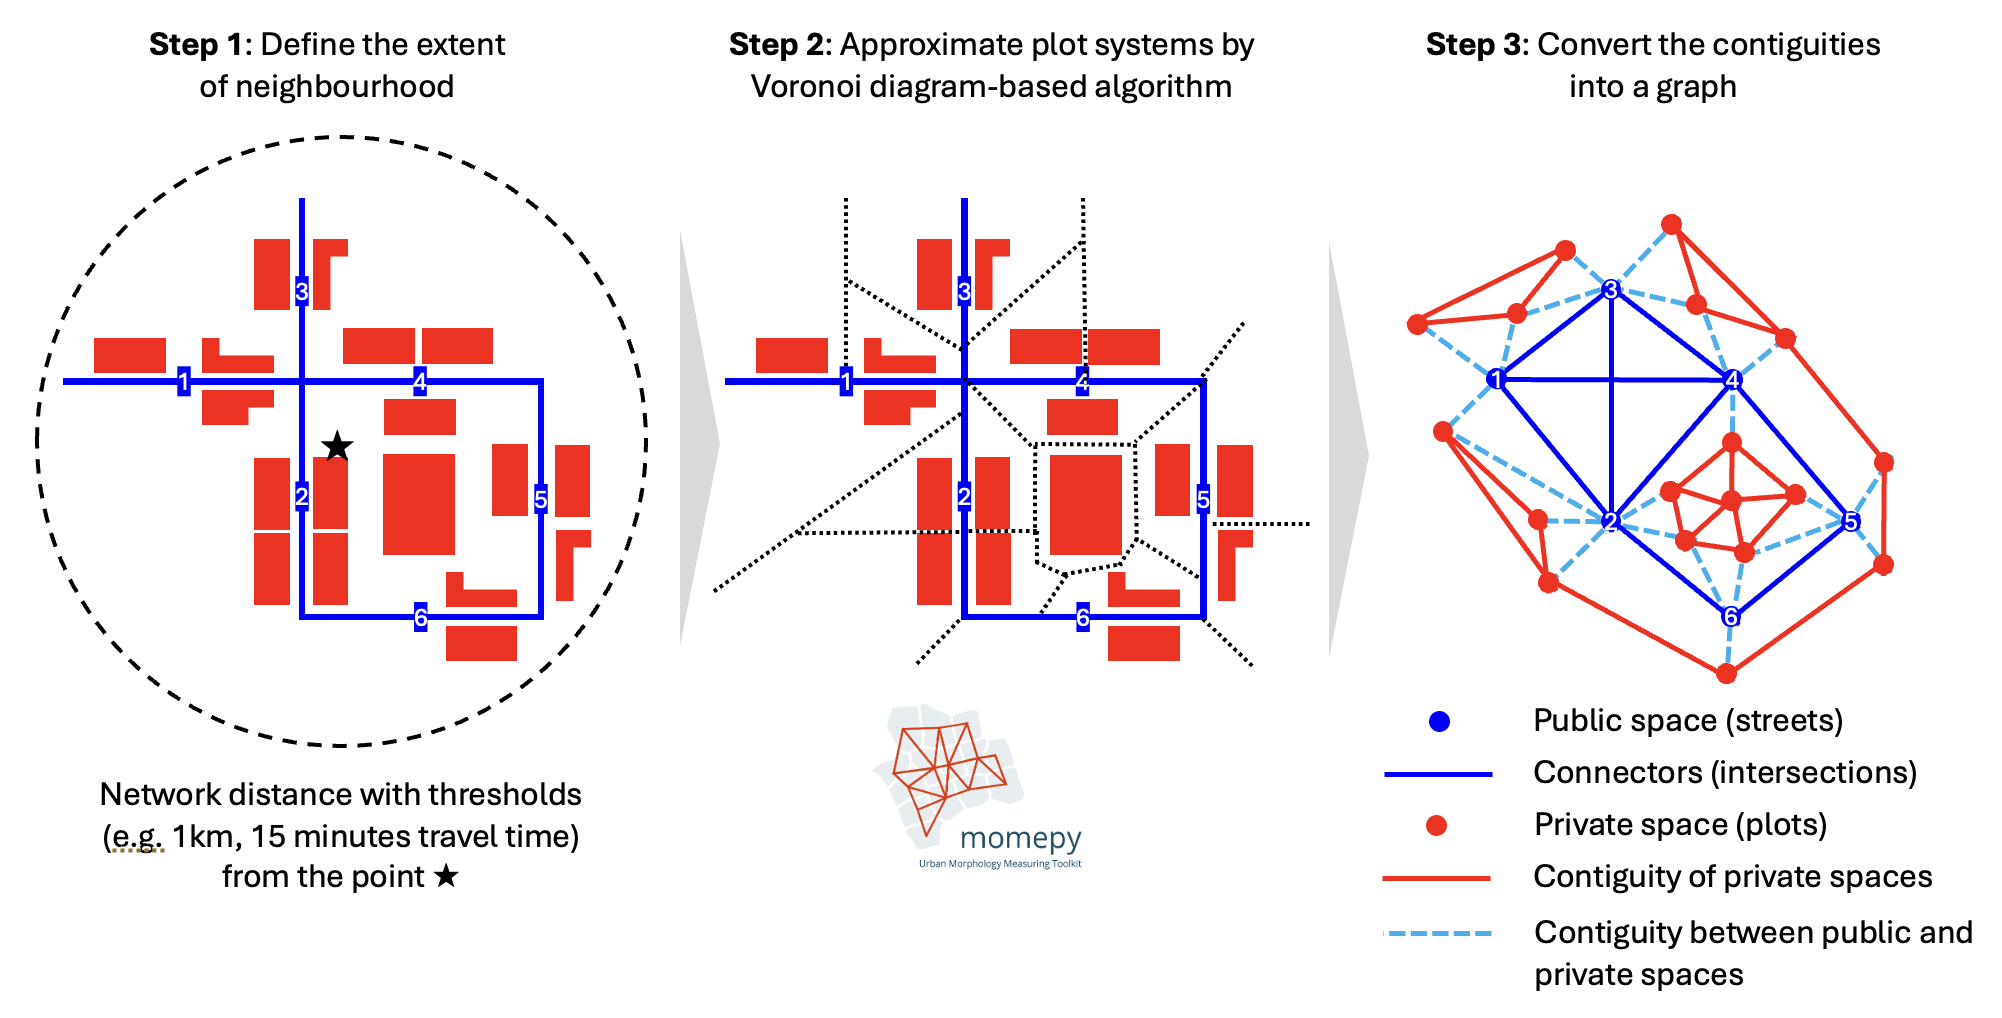
What are Morphological Graphs?
Morphological graphs are heterogeneous graphs where:
- Nodes represent both public spaces (street segments) and private spaces (enclosed areas/tessellations)
- Edges capture three types of spatial relationships:
- 🔴 Private-to-private: Adjacency between neighboring private spaces
- 🔵 Public-to-public: Connectivity along street networks (dual graph representation)
- 🟣 Private-to-public: Interface between private spaces and adjacent streets
Workflow Overview
- Data Loading: Import building footprints and street segments from Overture Maps
- Data Processing: Clean and prepare spatial data for network creation
- Morphological Graph Generation: Create tessellations and extract spatial relationships
- Graph Conversion: Convert to PyTorch Geometric for machine learning applications
- Visualization: Explore the resulting morphological graph
This approach enables advanced urban analytics including connectivity analysis, accessibility studies, and graph-based machine learning for urban form analysis.
1. Setup and Dependencies
# Core libraries
import numpy as np
import geopandas as gpd
import matplotlib.pyplot as plt
import contextily as cx
from shapely import Point

# city2graph for morphological graph analysis
import city2graph as c2g

# Configure matplotlib for high-quality visualizations
plt.rcParams['figure.figsize'] = (14, 10)
plt.rcParams['figure.dpi'] = 100
plt.rcParams['font.size'] = 11
plt.style.use('ggplot')

print("✅ Dependencies loaded successfully")
print(f"city2graph version: {c2g.__version__}")
print(f"geopandas version: {gpd.__version__}")
✅ Dependencies loaded successfully
city2graph version: 0.1.7
geopandas version: 1.1.1
2. Loading Data from Overture Maps
We'll work with real urban data from Liverpool, UK, using Overture Maps which provides high-quality, open geospatial data including:
- Building footprints: Representing private/built spaces
- Road segments: Representing the street network
- Connectors: Intersection points in the road network
The data covers Liverpool city centre and demonstrates how City2Graph can process real-world urban environments.
# Download data from Overture Maps (uncomment to download fresh data)
# This downloads building footprints, road segments, and connectors for Liverpool city centre

bbox = [-3.090173, 53.355487, -2.917138, 53.465587]  # Liverpool city centre bounding box

c2g.load_overture_data(
    area=bbox,
    types=["segment", "building", "connector"],
    output_dir="./data/overturemaps",
    prefix="liverpool_",
    save_to_file=True,
    return_data=False,
)

print("Data loading configuration complete")
print("To download fresh data, uncomment the city2graph.load_overture_data() call above")
Data loading configuration complete
To download fresh data, uncomment the city2graph.load_overture_data() call above
# Load the downloaded GeoJSON files
buildings_gdf = gpd.read_file("./data/overturemaps/liverpool_building.geojson")
segments_gdf = gpd.read_file("./data/overturemaps/liverpool_segment.geojson")
connectors_gdf = gpd.read_file("./data/overturemaps/liverpool_connector.geojson")

# Convert to British National Grid (EPSG:27700) for accurate distance calculations
buildings_gdf = buildings_gdf.to_crs(epsg=27700)
segments_gdf = segments_gdf.to_crs(epsg=27700)
connectors_gdf = connectors_gdf.to_crs(epsg=27700)

print("✅ Data loaded successfully!")
print(f"📊 Dataset summary:")
print(f"   • Buildings: {len(buildings_gdf):,}")
print(f"   • Road segments: {len(segments_gdf):,}")
print(f"   • Connectors: {len(connectors_gdf):,}")
print(f"   • CRS: {buildings_gdf.crs}")
✅ Data loaded successfully!
📊 Dataset summary:
   • Buildings: 132,549
   • Road segments: 38,523
   • Connectors: 48,758
   • CRS: EPSG:27700
3. Street Network Processing
Before creating morphological graphs, we need to process the raw street data. This involves:
- Filtering: Keep only road segments (exclude pedestrian paths, railways, etc.)
- Barrier Processing: Handle bridges and tunnels to create accurate spatial barriers
- Network Cleanup: Ensure proper connectivity for graph operations
The barrier_geometry column will contain the processed geometries that act as spatial barriers for tessellation.
# Filter to keep only road segments (excluding pedestrian paths, railways, etc.)
segments_gdf = segments_gdf[segments_gdf["subtype"] == "road"].copy()

# Process segments to handle bridges/tunnels and create proper spatial barriers
segments_gdf = c2g.process_overture_segments(
    segments_gdf=segments_gdf,
    get_barriers=True,
    connectors_gdf=connectors_gdf
)

print(f"✅ Processed {len(segments_gdf)} road segments")
print(f"📈 Barrier geometries created for tessellation")

# Check the geometry types in the barrier_geometry column
geometry_types = segments_gdf["barrier_geometry"].geom_type.value_counts()
print(f"\n🔍 Barrier geometry types:")
for geom_type, count in geometry_types.items():
    print(f"   • {geom_type}: {count:,}")
✅ Processed 63819 road segments
📈 Barrier geometries created for tessellation

🔍 Barrier geometry types:
   • LineString: 62,869
   • MultiLineString: 531
You can convert these segments to a (homogeneous) graph using the segments_to_graph function. Note that this function can be applied for any segments GeoDataFrame, not only for segments derived from OvertureMaps.
segments_G = c2g.segments_to_graph(segments_gdf, as_nx=True)
Removed 9 invalid geometries
c2g.plot_graph(segments_G)
<Axes: >

4. Creating Morphological Graphs
Now we'll create the morphological graph - the core contribution of City2Graph. This process:
The Process:
- Tessellation Creation: Divide space into private areas using street segments as barriers
- Network Extraction: Identify three types of spatial relationships:
- Private-to-private (red): Adjacency between neighboring private spaces
- Public-to-public (blue): Connectivity along street networks
- Private-to-public (purple): Interface between private spaces and streets
Why Morphological Graphs?
Unlike traditional approaches that analyze street networks and buildings separately, morphological graphs provide a unified representation of urban space that:
- Captures the complete topology of public and private spaces
- Enables holistic urban analysis combining street accessibility and land use
- Provides a foundation for spatially-explicit graph machine learning
- Supports integration of diverse urban attributes (POIs, demographics, functions)
# Define center point for the analysis area (Liverpool city centre)
center_point = gpd.GeoSeries([Point(-2.9879004, 53.4062724)], crs='EPSG:4326').to_crs(epsg=27700)

# Create the morphological graph
morpho_nodes, morpho_edges = c2g.morphological_graph(
    buildings_gdf=buildings_gdf,
    segments_gdf=segments_gdf,
    center_point=center_point,
    distance=500,                    # Analysis radius in meters
    clipping_buffer=300,            # Buffer for edge effects
    primary_barrier_col='barrier_geometry',
    contiguity="queen",             # Adjacency rule for tessellation
    keep_buildings=True,            # Preserve building geometries
)
Removed 9 invalid geometries
/Users/yutasato/Projects/Liverpool/city2graph/.venv/lib/python3.13/site-packages/libpysal/weights/contiguity.py:347: UserWarning: The weights matrix is not fully connected:
 There are 3 disconnected components.
 There are 2 islands with ids: 32_107405, 32_107413.
  W.__init__(self, neighbors, ids=ids, **kw)
print(f"Node types: {list(morpho_nodes.keys())}")
print(f"Edge types: {list(morpho_edges.keys())}")
print(f"Private spaces: {len(morpho_nodes['private']):,}")
print(f"Public spaces: {len(morpho_nodes['public']):,}")

for edge_type, edge_gdf in morpho_edges.items():
    print(f"   • {edge_type}: {len(edge_gdf):,} connections")
Node types: ['private', 'public']
Edge types: [('private', 'touched_to', 'private'), ('public', 'connected_to', 'public'), ('private', 'faced_to', 'public')]
Private spaces: 1,342
Public spaces: 801
   • ('private', 'touched_to', 'private'): 615 connections
   • ('public', 'connected_to', 'public'): 1,475 connections
   • ('private', 'faced_to', 'public'): 2,503 connections
morpho_nodes["private"].head()
| geometry | enclosure_index | id | version | sources | level | subtype | class | height | names | ... | facade_color | facade_material | roof_material | roof_shape | roof_direction | roof_orientation | roof_color | roof_height | building_geometry | tessellation_geometry | |
|---|---|---|---|---|---|---|---|---|---|---|---|---|---|---|---|---|---|---|---|---|---|
| private_id | |||||||||||||||||||||
| 12_31956 | POINT (334727.903 390226.444) | 12 | c904b7f1-c8dc-4892-bc1d-c40589a14df2 | 2.0 | [{'property': '', 'dataset': 'OpenStreetMap', ... | NaN | commercial | retail | 22.054096 | {'primary': 'Primark', 'common': None, 'rules'... | ... | None | None | None | None | NaN | None | None | NaN | POLYGON ((334741.448 390215.167, 334756.666 39... | POLYGON ((334755.579 390206.699, 334741.754 39... |
| 12_31956 | POINT (334727.903 390226.444) | 12 | dc8bce71-dc2c-4f77-aef2-38d97e5587ad | 1.0 | [{'property': '', 'dataset': 'OpenStreetMap', ... | NaN | None | None | NaN | None | ... | None | None | None | None | NaN | None | None | NaN | POLYGON ((334765.068 390239.944, 334756.666 39... | POLYGON ((334755.579 390206.699, 334741.754 39... |
| 12_31957 | POINT (334783.221 390224.611) | 12 | 6e125793-4950-4b77-a574-98bf89e02f7a | 1.0 | [{'property': '', 'dataset': 'OpenStreetMap', ... | NaN | None | None | NaN | {'primary': 'Pauline Books & Media', 'common':... | ... | None | None | None | None | NaN | None | None | NaN | POLYGON ((334808.007 390196.826, 334817.382 39... | POLYGON ((334768.613 390253.5, 334803.709 3902... |
| 12_31957 | POINT (334783.221 390224.611) | 12 | c904b7f1-c8dc-4892-bc1d-c40589a14df2 | 2.0 | [{'property': '', 'dataset': 'OpenStreetMap', ... | NaN | commercial | retail | 22.054096 | {'primary': 'Primark', 'common': None, 'rules'... | ... | None | None | None | None | NaN | None | None | NaN | POLYGON ((334741.448 390215.167, 334756.666 39... | POLYGON ((334768.613 390253.5, 334803.709 3902... |
| 12_31957 | POINT (334783.221 390224.611) | 12 | dc8bce71-dc2c-4f77-aef2-38d97e5587ad | 1.0 | [{'property': '', 'dataset': 'OpenStreetMap', ... | NaN | None | None | NaN | None | ... | None | None | None | None | NaN | None | None | NaN | POLYGON ((334765.068 390239.944, 334756.666 39... | POLYGON ((334768.613 390253.5, 334803.709 3902... |
5 rows × 25 columns
morpho_nodes["public"].head()
| id | version | sources | subtype | class | names | connectors | routes | subclass_rules | access_restrictions | ... | road_flags | speed_limits | width_rules | subclass | geometry | split_from | split_to | length | barrier_geometry | segment_geometry | |
|---|---|---|---|---|---|---|---|---|---|---|---|---|---|---|---|---|---|---|---|---|---|
| public_id | |||||||||||||||||||||
| 56159 | a5e01c9b-5290-4eab-a020-ee9e7e157760_1 | 1 | [{'property': '', 'dataset': 'OpenStreetMap', ... | road | unclassified | {'primary': 'Tower Gardens', 'common': None, '... | [{'connector_id': '137acfba-67ce-4882-9720-be9... | None | None | None | ... | None | None | None | None | POINT (334032.697 390390.027) | 0.000000 | 0.127877 | 7.849774 | LINESTRING (334034.687 390386.645, 334030.706 ... | LINESTRING (334034.687 390386.645, 334030.706 ... |
| 56180 | d9dca30b-31ca-4d72-8c6f-b2e6195ae33d_1 | 1 | [{'property': '', 'dataset': 'OpenStreetMap', ... | road | primary | {'primary': 'Water Street', 'common': None, 'r... | [{'connector_id': '137acfba-67ce-4882-9720-be9... | [{'name': None, 'network': None, 'ref': 'A57',... | None | [{'access_type': 'denied', 'when': {'during': ... | ... | None | [{'min_speed': None, 'max_speed': {'value': 30... | None | None | POINT (334018.757 390377.991) | 0.000000 | 0.725988 | 36.258554 | LINESTRING (334034.687 390386.645, 334005.825 ... | LINESTRING (334034.687 390386.645, 334005.825 ... |
| 56391 | 4704f2a4-75b5-47d4-9270-4261f9459742 | 1 | [{'property': 'routes', 'dataset': 'OpenStreet... | road | primary | {'primary': 'Water Street', 'common': None, 'r... | [{'connector_id': 'a62ffd87-a56f-4a02-bf30-67d... | [{'name': None, 'network': None, 'ref': 'A57',... | None | [{'access_type': 'denied', 'when': {'during': ... | ... | None | [{'min_speed': None, 'max_speed': {'value': 30... | None | None | POINT (334041.874 390390.851) | NaN | NaN | 16.653532 | LINESTRING (334049.06 390395.057, 334034.687 3... | LINESTRING (334049.06 390395.057, 334034.687 3... |
| 56178 | 66a3f6ca-888c-43cd-bc30-50dff8d09325_5 | 1 | [{'property': '', 'dataset': 'OpenStreetMap', ... | road | cycleway | {'primary': 'Water Street', 'common': None, 'r... | [{'connector_id': 'ff54a37c-c0b9-4338-be77-b37... | None | None | [{'access_type': 'denied', 'when': {'during': ... | ... | None | None | None | None | POINT (334015.167 390383.574) | 0.332346 | 0.591025 | 36.779102 | LINESTRING (333999.652 390373.703, 333999.652 ... | LINESTRING (333999.652 390373.703, 333999.652 ... |
| 56179 | 66a3f6ca-888c-43cd-bc30-50dff8d09325_6 | 1 | [{'property': '', 'dataset': 'OpenStreetMap', ... | road | cycleway | {'primary': 'Water Street', 'common': None, 'r... | [{'connector_id': 'ff54a37c-c0b9-4338-be77-b37... | None | None | [{'access_type': 'denied', 'when': {'during': ... | ... | None | None | None | None | POINT (334055.463 390408.654) | 0.591025 | 1.000000 | 58.148253 | LINESTRING (334030.706 390393.41, 334030.706 3... | LINESTRING (334030.706 390393.41, 334030.706 3... |
5 rows × 25 columns
morpho_edges[('public', 'connected_to', 'public')].head()
| geometry | ||
|---|---|---|
| from_public_id | to_public_id | |
| 23570 | 24229 | LINESTRING (334597.772 390729.399, 334589.75 3... |
| 24230 | LINESTRING (334597.772 390729.399, 334587.034 ... | |
| 24235 | LINESTRING (334597.772 390729.399, 334611.822 ... | |
| 24255 | LINESTRING (334597.772 390729.399, 334582.53 3... | |
| 23577 | 24232 | LINESTRING (334615.698 390739.427, 334602.944 ... |
morpho_edges[('private', 'faced_to', 'public')].head()
| geometry | ||
|---|---|---|
| private_id | public_id | |
| 183_107526 | 56159 | LINESTRING (334054.645 390363.231, 334032.697 ... |
| 182_-160 | 56159 | LINESTRING (334017.91 390381.351, 334032.697 3... |
| 181_-161 | 56159 | LINESTRING (334058.29 390405.424, 334032.697 3... |
| 180_107446 | 56159 | LINESTRING (333990.617 390408.84, 334032.697 3... |
| 179_107445 | 56159 | LINESTRING (334020.81 390464.168, 334032.697 3... |
morpho_edges[('private', 'touched_to', 'private')].head()
| weight | geometry | enclosure_index | ||
|---|---|---|---|---|
| from_private_id | to_private_id | |||
| 12_31956 | 12_31957 | 55.347745 | LINESTRING (334727.903 390226.444, 334783.221 ... | 12 |
| 12_31957 | 12_31968 | 28.277931 | LINESTRING (334783.221 390224.611, 334810.774 ... | 12 |
| 12_31967 | 12_31968 | 19.731447 | LINESTRING (334829.869 390213.279, 334810.774 ... | 12 |
| 20_33139 | 20_33140 | 7.723210 | LINESTRING (334667.044 390104.963, 334659.849 ... | 20 |
| 20_33142 | 72.502424 | LINESTRING (334667.044 390104.963, 334600.224 ... | 20 |
morpho_nodes["public"]
| id | version | sources | subtype | class | names | connectors | routes | subclass_rules | access_restrictions | ... | road_flags | speed_limits | width_rules | subclass | geometry | split_from | split_to | length | barrier_geometry | segment_geometry | |
|---|---|---|---|---|---|---|---|---|---|---|---|---|---|---|---|---|---|---|---|---|---|
| public_id | |||||||||||||||||||||
| 56159 | a5e01c9b-5290-4eab-a020-ee9e7e157760_1 | 1 | [{'property': '', 'dataset': 'OpenStreetMap', ... | road | unclassified | {'primary': 'Tower Gardens', 'common': None, '... | [{'connector_id': '137acfba-67ce-4882-9720-be9... | None | None | None | ... | None | None | None | None | POINT (334032.697 390390.027) | 0.000000 | 0.127877 | 7.849774 | LINESTRING (334034.687 390386.645, 334030.706 ... | LINESTRING (334034.687 390386.645, 334030.706 ... |
| 56180 | d9dca30b-31ca-4d72-8c6f-b2e6195ae33d_1 | 1 | [{'property': '', 'dataset': 'OpenStreetMap', ... | road | primary | {'primary': 'Water Street', 'common': None, 'r... | [{'connector_id': '137acfba-67ce-4882-9720-be9... | [{'name': None, 'network': None, 'ref': 'A57',... | None | [{'access_type': 'denied', 'when': {'during': ... | ... | None | [{'min_speed': None, 'max_speed': {'value': 30... | None | None | POINT (334018.757 390377.991) | 0.000000 | 0.725988 | 36.258554 | LINESTRING (334034.687 390386.645, 334005.825 ... | LINESTRING (334034.687 390386.645, 334005.825 ... |
| 56391 | 4704f2a4-75b5-47d4-9270-4261f9459742 | 1 | [{'property': 'routes', 'dataset': 'OpenStreet... | road | primary | {'primary': 'Water Street', 'common': None, 'r... | [{'connector_id': 'a62ffd87-a56f-4a02-bf30-67d... | [{'name': None, 'network': None, 'ref': 'A57',... | None | [{'access_type': 'denied', 'when': {'during': ... | ... | None | [{'min_speed': None, 'max_speed': {'value': 30... | None | None | POINT (334041.874 390390.851) | NaN | NaN | 16.653532 | LINESTRING (334049.06 390395.057, 334034.687 3... | LINESTRING (334049.06 390395.057, 334034.687 3... |
| 56178 | 66a3f6ca-888c-43cd-bc30-50dff8d09325_5 | 1 | [{'property': '', 'dataset': 'OpenStreetMap', ... | road | cycleway | {'primary': 'Water Street', 'common': None, 'r... | [{'connector_id': 'ff54a37c-c0b9-4338-be77-b37... | None | None | [{'access_type': 'denied', 'when': {'during': ... | ... | None | None | None | None | POINT (334015.167 390383.574) | 0.332346 | 0.591025 | 36.779102 | LINESTRING (333999.652 390373.703, 333999.652 ... | LINESTRING (333999.652 390373.703, 333999.652 ... |
| 56179 | 66a3f6ca-888c-43cd-bc30-50dff8d09325_6 | 1 | [{'property': '', 'dataset': 'OpenStreetMap', ... | road | cycleway | {'primary': 'Water Street', 'common': None, 'r... | [{'connector_id': 'ff54a37c-c0b9-4338-be77-b37... | None | None | [{'access_type': 'denied', 'when': {'during': ... | ... | None | None | None | None | POINT (334055.463 390408.654) | 0.591025 | 1.000000 | 58.148253 | LINESTRING (334030.706 390393.41, 334030.706 3... | LINESTRING (334030.706 390393.41, 334030.706 3... |
| ... | ... | ... | ... | ... | ... | ... | ... | ... | ... | ... | ... | ... | ... | ... | ... | ... | ... | ... | ... | ... | ... |
| 55826 | c91bfcc0-f0c3-4d8b-86f0-219e304ea73c_1 | 2 | [{'property': '', 'dataset': 'OpenStreetMap', ... | road | trunk | {'primary': 'Strand Street', 'common': None, '... | [{'connector_id': '462f0807-4888-4a3c-bd91-e7d... | None | None | [{'access_type': 'denied', 'when': {'during': ... | ... | None | [{'min_speed': None, 'max_speed': {'value': 30... | None | None | POINT (334126.221 390166.28) | 0.000000 | 0.519847 | 42.759490 | LINESTRING (334112.436 390182.618, 334116.051 ... | LINESTRING (334112.436 390182.618, 334116.051 ... |
| 55839 | bf145e29-c53d-44d2-9a78-c0546b071a40_1 | 2 | [{'property': '', 'dataset': 'OpenStreetMap', ... | road | trunk | {'primary': 'Strand Street', 'common': None, '... | [{'connector_id': '3617e7cc-e871-45f5-a8a4-ccb... | None | None | [{'access_type': 'denied', 'when': {'during': ... | ... | None | [{'min_speed': None, 'max_speed': {'value': 30... | None | None | POINT (334095.885 390172.017) | 0.000000 | 0.672058 | 40.225191 | LINESTRING (334108.506 390156.357, 334086.439 ... | LINESTRING (334108.506 390156.357, 334086.439 ... |
| 55846 | 3484a50c-97cc-419d-98d4-504e6cf2db09_4 | 1 | [{'property': '', 'dataset': 'OpenStreetMap', ... | road | footway | None | [{'connector_id': '6a832436-a808-439b-9379-e16... | None | None | None | ... | None | None | None | None | POINT (334080.751 390185.634) | 0.694893 | 0.766920 | 6.367964 | LINESTRING (334078.252 390183.661, 334078.253 ... | LINESTRING (334078.252 390183.661, 334078.253 ... |
| 55845 | 3484a50c-97cc-419d-98d4-504e6cf2db09_3 | 1 | [{'property': '', 'dataset': 'OpenStreetMap', ... | road | footway | None | [{'connector_id': '6a832436-a808-439b-9379-e16... | None | None | None | ... | None | None | None | None | POINT (334073.571 390180.984) | 0.572882 | 0.694893 | 10.786927 | LINESTRING (334068.889 390178.306, 334068.889 ... | LINESTRING (334068.889 390178.306, 334068.889 ... |
| 55856 | d45a56ad-c452-46a6-ab9d-42ec9f35bb54_1 | 1 | [{'property': '', 'dataset': 'OpenStreetMap', ... | road | unclassified | {'primary': 'George's Dock Way', 'common': Non... | [{'connector_id': '16a1387d-5006-4ed0-8760-668... | None | None | [{'access_type': 'denied', 'when': {'during': ... | ... | None | [{'min_speed': None, 'max_speed': {'value': 30... | None | None | POINT (333974.723 390256.75) | 0.000000 | 0.041809 | 8.512544 | LINESTRING (333971.855 390259.894, 333977.592 ... | LINESTRING (333971.855 390259.894, 333977.592 ... |
801 rows × 25 columns
fig, ax = plt.subplots(figsize=(14, 12), facecolor='#f9f9f9')

morpho_nodes["private"]["building_geometry"].plot(ax=ax, color='#e0e0e0', edgecolor='#c0c0c0', linewidth=0.3, alpha=0.7)
morpho_nodes["public"]["segment_geometry"].plot(ax=ax, color='#404040', linewidth=0.7, alpha=0.6)

c2g.plot_graph(
    nodes=morpho_nodes,
    edges=morpho_edges,
    subplots=False,
    ax=ax,
    bgcolor="#f9f9f9",
    labelcolor="#000000",
    node_color={'private': 'red', 'public': 'blue'},
    edge_color={
        ('private', 'touched_to', 'private'): '#B22222',
        ('public', 'connected_to', 'public'): '#0000FF',
        ('private', 'faced_to', 'public'): '#7B68EE',
    },
    markersize=10,
    linewidth=0.2,
)
<Axes: >

6. Converting to Graph Representations for Machine Learning
City2Graph provides seamless conversion between spatial data and graph formats optimized for machine learning. We'll demonstrate conversion to PyTorch Geometric, enabling advanced graph neural network applications for urban analysis.
Graph Format Support:
- NetworkX: For traditional graph analysis and algorithms
- PyTorch Geometric: For deep learning on graphs
- GeoDataFrames: For spatial analysis and visualization
This interoperability allows researchers to leverage the best tools for each analysis task.
# Check for PyTorch Geometric availability
import torch

try:
    import torch_geometric
    HAS_TORCH_GEOMETRIC = True
    print("✅ PyTorch Geometric successfully imported")
    print(f"   PyTorch version: {torch.__version__}")
    print(f"   PyTorch Geometric version: {torch_geometric.__version__}")
    print("🚀 Ready for graph representation learning!")
except ImportError:
    HAS_TORCH_GEOMETRIC = False
    print("⚠️  PyTorch Geometric not installed")
    print("   Install with: pip install torch-geometric")
    print("   Graph functionality will be limited to NetworkX")
✅ PyTorch Geometric successfully imported
   PyTorch version: 2.9.1
   PyTorch Geometric version: 2.7.0
🚀 Ready for graph representation learning!
6.1 Homogeneous Graph: Private Space Network
Let's start with a homogeneous graph focusing on private spaces (tessellation cells) and their adjacency relationships. This represents the spatial structure of plots and parcels in the urban environment.
# Compute spatial features for private spaces (tessellation cells)
morpho_nodes["private"]["area"] = morpho_nodes["private"].geometry.area
morpho_nodes["private"]["perimeter"] = morpho_nodes["private"].geometry.length
morpho_nodes["private"]["compactness"] = (
    4 * np.pi * morpho_nodes["private"]["area"] / (morpho_nodes["private"]["perimeter"] ** 2)
)

print("📊 Computed spatial features for private spaces:")
feature_stats = morpho_nodes["private"][['area', 'perimeter', 'compactness']].describe()
print(feature_stats.round(2))

# Set proper index names for graph conversion
morpho_nodes["private"].index.name = "tess_id"
morpho_edges[('private', 'touched_to', 'private')].index.names = ['from_private_id', 'to_private_id']

print("\n✅ Features computed and indices configured")
📊 Computed spatial features for private spaces:
         area  perimeter  compactness
count  1342.0     1342.0          0.0
mean      0.0        0.0          NaN
std       0.0        0.0          NaN
min       0.0        0.0          NaN
25%       0.0        0.0          NaN
50%       0.0        0.0          NaN
75%       0.0        0.0          NaN
max       0.0        0.0          NaN

✅ Features computed and indices configured
if HAS_TORCH_GEOMETRIC:
    # Create homogeneous graph of private spaces
    private_graph = c2g.gdf_to_pyg(
        nodes=morpho_nodes["private"],
        edges=morpho_edges[('private', 'touched_to', 'private')],
        node_feature_cols=['area', 'perimeter', 'compactness'],
        edge_feature_cols=None
    )

    print("🎯 Created homogeneous graph:")
    print(f"   • Nodes: {private_graph.num_nodes:,}")
    print(f"   • Edges: {private_graph.num_edges:,}")
    print(f"   • Node features: {private_graph.x.shape[1]} dimensions")
    print(f"   • Feature tensor shape: {private_graph.x.shape}")
    print("\n✅ Ready for graph neural network training!")

else:
    print("⚠️ Skipping PyTorch Geometric conversion (not installed)")
    private_graph = None
🎯 Created homogeneous graph:
   • Nodes: 1,342
   • Edges: 615
   • Node features: 3 dimensions
   • Feature tensor shape: torch.Size([1342, 3])

✅ Ready for graph neural network training!
Test Graph Conversions
Let's test the round-trip conversions between different graph formats to ensure data integrity:
6.2 Heterogeneous Graph: Complete Morphological Graph
Now let's create a heterogeneous graph that captures the full morphological graph with all node and edge types. This provides the complete representation for advanced urban analysis.
# Define center point for the analysis area (Liverpool city centre)
center_point = gpd.GeoSeries([Point(-2.9879004, 53.4062724)], crs='EPSG:4326').to_crs(epsg=27700)

# Create the morphological graph
print("🏗️  Creating morphological graph...")
morpho_nodes, morpho_edges = c2g.morphological_graph(
    buildings_gdf=buildings_gdf,
    segments_gdf=segments_gdf,
    center_point=center_point,
    distance=500,                    # Analysis radius in meters
    clipping_buffer=300,            # Buffer for edge effects
    primary_barrier_col='barrier_geometry',
    contiguity="queen",             # Adjacency rule for tessellation
    keep_buildings=True,            # Preserve building geometries
)

print("✅ Morphological graph created successfully!")
print(f"📊 Network summary:")
print(f"   • Node types: {list(morpho_nodes.keys())}")
print(f"   • Edge types: {list(morpho_edges.keys())}")
print(f"   • Private spaces: {len(morpho_nodes['private']):,}")
print(f"   • Public spaces: {len(morpho_nodes['public']):,}")

for edge_type, edge_gdf in morpho_edges.items():
    print(f"   • {edge_type}: {len(edge_gdf):,} connections")
Removed 9 invalid geometries
🏗️  Creating morphological graph...
✅ Morphological graph created successfully!
📊 Network summary:
   • Node types: ['private', 'public']
   • Edge types: [('private', 'touched_to', 'private'), ('public', 'connected_to', 'public'), ('private', 'faced_to', 'public')]
   • Private spaces: 1,342
   • Public spaces: 801
   • ('private', 'touched_to', 'private'): 615 connections
   • ('public', 'connected_to', 'public'): 1,475 connections
   • ('private', 'faced_to', 'public'): 2,503 connections
/Users/yutasato/Projects/Liverpool/city2graph/.venv/lib/python3.13/site-packages/libpysal/weights/contiguity.py:347: UserWarning: The weights matrix is not fully connected:
 There are 3 disconnected components.
 There are 2 islands with ids: 32_107405, 32_107413.
  W.__init__(self, neighbors, ids=ids, **kw)
# Compute features for public spaces (street segments)
morpho_nodes["public"]["length"] = morpho_nodes["public"].geometry.length

print("📊 Computed spatial features for public spaces:")
print(f"   • Street length statistics:")
length_stats = morpho_nodes["public"]["length"].describe()
print(f"     - Mean: {length_stats['mean']:.1f}m")
print(f"     - Median: {length_stats['50%']:.1f}m")
print(f"     - Range: {length_stats['min']:.1f}m - {length_stats['max']:.1f}m")

print(f"\n✅ Features ready for heterogeneous graph creation")
📊 Computed spatial features for public spaces:
   • Street length statistics:
     - Mean: 0.0m
     - Median: 0.0m
     - Range: 0.0m - 0.0m

✅ Features ready for heterogeneous graph creation
if HAS_TORCH_GEOMETRIC:
    # Create heterogeneous graph with all morphological relationships
    hetero_graph = c2g.gdf_to_pyg(
        morpho_nodes,
        morpho_edges,
        node_feature_cols={
            "private": ['area', 'perimeter', 'compactness'],
            "public": ['length']
        }
    )

    print("🌐 Created heterogeneous morphological graph:")
    print(f"   📊 Node types and counts:")
    for node_type in hetero_graph.node_types:
        num_nodes = hetero_graph[node_type].x.shape[0]
        num_features = hetero_graph[node_type].x.shape[1]
        print(f"     • {node_type}: {num_nodes:,} nodes, {num_features} features")

    print(f"   🔗 Edge types and counts:")
    for edge_type in hetero_graph.edge_types:
        num_edges = hetero_graph[edge_type].edge_index.shape[1]
        print(f"     • {edge_type}: {num_edges:,} edges")

    print("\n✅ Complete morphological graph ready for heterogeneous GNN training!")

else:
    print("⚠️ Skipping PyTorch Geometric conversion (not installed)")
    hetero_graph = None
🌐 Created heterogeneous morphological graph:
   📊 Node types and counts:
     • private: 1,342 nodes, 0 features
     • public: 801 nodes, 1 features
   🔗 Edge types and counts:
     • ('private', 'touched_to', 'private'): 615 edges
     • ('public', 'connected_to', 'public'): 1,475 edges
     • ('private', 'faced_to', 'public'): 2,503 edges

✅ Complete morphological graph ready for heterogeneous GNN training!
hetero_graph
HeteroData(
  crs=EPSG:27700,
  graph_metadata=<city2graph.base.GraphMetadata object at 0x15a3a3d90>,
  private={
    x=[1342, 0],
    pos=[1342, 2],
  },
  public={
    x=[801, 1],
    pos=[801, 2],
  },
  (private, touched_to, private)={
    edge_index=[2, 615],
    edge_attr=[615, 0],
  },
  (public, connected_to, public)={
    edge_index=[2, 1475],
    edge_attr=[1475, 0],
  },
  (private, faced_to, public)={
    edge_index=[2, 2503],
    edge_attr=[2503, 0],
  }
)
6.3 Using NetworkX
City2Graph provides seamless conversion to NetworkX for traditional graph analysis and algorithms. This enables access to the rich ecosystem of graph analysis tools.
morpho_graph = c2g.gdf_to_pyg(
    morpho_nodes,
    morpho_edges,
    node_feature_cols={"private": ['area', 'perimeter', 'compactness'],
                       "public": ['length']},
                       )

# Convert morphological graph to NetworkX for traditional graph analysis
G_morpho = c2g.gdf_to_nx(morpho_nodes, morpho_edges)

print("🔗 Converted to NetworkX:")
print(f"   • Total nodes: {G_morpho.number_of_nodes():,}")
print(f"   • Total edges: {G_morpho.number_of_edges():,}")
print(f"   • Graph type: {'Directed' if G_morpho.is_directed() else 'Undirected'}")

# Check if it's a heterogeneous graph
has_node_types = any('node_type' in data for _, data in G_morpho.nodes(data=True))
print(f"   • Heterogeneous: {'Yes' if has_node_types else 'No'}")

if has_node_types:
    # Count nodes by type
    from collections import Counter
    node_types = [data.get('node_type', 'unknown') for _, data in G_morpho.nodes(data=True)]
    type_counts = Counter(node_types)
    print(f"   • Node type distribution:")
    for node_type, count in type_counts.items():
        print(f"     - {node_type}: {count:,}")

print("\n✅ Ready for NetworkX graph analysis algorithms!")
🔗 Converted to NetworkX:
   • Total nodes: 2,143
   • Total edges: 4,593
   • Graph type: Undirected
   • Heterogeneous: Yes
   • Node type distribution:
     - private: 1,342
     - public: 801

✅ Ready for NetworkX graph analysis algorithms!
7. OpenStreetMap
As a reference, you can execute the same process using OpenStreetMap dataset, extracted by osmnx.
import osmnx as ox

# Download and create a street network graph for Liverpool, UK
G_osmnx = ox.graph_from_place("Liverpool, UK", network_type="all")

print(f"✅ OSMnx graph created for Liverpool, UK")
print(f"   • Nodes: {len(G_osmnx.nodes):,}")
print(f"   • Edges: {len(G_osmnx.edges):,}")
✅ OSMnx graph created for Liverpool, UK
   • Nodes: 45,081
   • Edges: 114,978
# Download POIs (amenities, shops, etc.) in Liverpool, UK
tags = {"building": True}
osm_buildings = ox.features_from_place("Liverpool, UK", tags)

print(f"✅ Retrieved {len(osm_buildings):,} buildings from OSMnx")
osm_buildings.head()
✅ Retrieved 77,492 buildings from OSMnx
| geometry | building | building:material | building:use | name | emergency | addr:street | shop | website | addr:city | ... | service:bicycle:parts | service:bicycle:pump | service:bicycle:second_hand | service:bicycle:spare_parts | type | school:trust | school:trust:name | school:trust:type | manager | last_checked | ||
|---|---|---|---|---|---|---|---|---|---|---|---|---|---|---|---|---|---|---|---|---|---|---|
| element | id | |||||||||||||||||||||
| node | 130190976 | POINT (-2.92799 53.37127) | yes | brick | religious | Saint Anne's Parish Hall - 1902 | NaN | NaN | NaN | NaN | NaN | ... | NaN | NaN | NaN | NaN | NaN | NaN | NaN | NaN | NaN | NaN |
| 252558860 | POINT (-2.91785 53.396) | residential | NaN | NaN | Bradbury House | NaN | NaN | NaN | NaN | NaN | ... | NaN | NaN | NaN | NaN | NaN | NaN | NaN | NaN | NaN | NaN | |
| 299317179 | POINT (-2.97904 53.39175) | yes | NaN | NaN | Toxteth Ambulance Station | ambulance_station | NaN | NaN | NaN | NaN | ... | NaN | NaN | NaN | NaN | NaN | NaN | NaN | NaN | NaN | NaN | |
| 1563152870 | POINT (-2.91166 53.41248) | manufacture | NaN | NaN | Tom Williams Cake Factory | NaN | Broad Green Road | pastry | http://www.cakefactory.co.uk/ | NaN | ... | NaN | NaN | NaN | NaN | NaN | NaN | NaN | NaN | NaN | NaN | |
| 1669223582 | POINT (-2.96855 53.40601) | yes | NaN | NaN | ALL (Active Learning Laboratory) | NaN | NaN | NaN | NaN | NaN | ... | NaN | NaN | NaN | NaN | NaN | NaN | NaN | NaN | NaN | NaN |
5 rows × 378 columns
If you want to directly convert the nx.MultiGraph into torch_geometric.data.Data,
osm_data = c2g.nx_to_pyg(G_osmnx)
osm_data
Data(x=[45081, 0], edge_index=[2, 114978], edge_attr=[114978, 0], pos=[45081, 2], graph_metadata=<city2graph.base.GraphMetadata object at 0x14b8aab60>)
Or you can convert it into GeoDataFrame that is compatible to other functions in City2Graph,
osm_street_nodes, osm_street_edges =c2g.nx_to_gdf(G_osmnx)
osm_street_nodes.head()
| y | x | street_count | geometry | highway | ref | junction | |
|---|---|---|---|---|---|---|---|
| 324206 | 53.407123 | -2.884331 | 3 | POINT (-2.88433 53.40712) | NaN | NaN | NaN |
| 324209 | 53.405943 | -2.896571 | 3 | POINT (-2.89657 53.40594) | NaN | NaN | NaN |
| 324210 | 53.406113 | -2.896688 | 3 | POINT (-2.89669 53.40611) | motorway_junction | 4 | NaN |
| 324216 | 53.406488 | -2.899987 | 3 | POINT (-2.89999 53.40649) | NaN | NaN | NaN |
| 324217 | 53.407391 | -2.902198 | 3 | POINT (-2.9022 53.40739) | NaN | NaN | NaN |
osm_street_edges.head()
| osmid | highway | lanes | maxspeed | oneway | ref | reversed | length | bridge | geometry | name | junction | service | access | width | tunnel | est_width | |||
|---|---|---|---|---|---|---|---|---|---|---|---|---|---|---|---|---|---|---|---|
| 324206 | 324209 | 0 | [28181793, 627409058, 546631471, 1155945617, 1... | motorway | 3 | [70 mph, 40 mph, 50 mph] | True | M62 | False | 823.913652 | yes | LINESTRING (-2.88433 53.40712, -2.88494 53.407... | NaN | NaN | NaN | NaN | NaN | NaN | NaN |
| 324209 | 3467956864 | 0 | 15215646 | trunk | 3 | 40 mph | True | A5080 | False | 52.584979 | NaN | LINESTRING (-2.89657 53.40594, -2.89678 53.405... | Bowring Park Road | NaN | NaN | NaN | NaN | NaN | NaN |
| 324210 | 11385898804 | 0 | 15215652 | primary | NaN | 40 mph | True | A5080 | False | 32.304470 | NaN | LINESTRING (-2.89669 53.40611, -2.89629 53.406... | Bowring Park Road | NaN | NaN | NaN | NaN | NaN | NaN |
| 324216 | 21026685 | 0 | 4002276 | trunk | 3 | 40 mph | True | A5080 | False | 87.887476 | NaN | LINESTRING (-2.89999 53.40649, -2.90028 53.406... | Edge Lane Drive | NaN | NaN | NaN | NaN | NaN | NaN |
| 21026680 | 0 | 4002284 | trunk_link | NaN | 40 mph | True | NaN | False | 61.909425 | NaN | LINESTRING (-2.89999 53.40649, -2.90029 53.406... | NaN | NaN | NaN | NaN | NaN | NaN | NaN |
To constrcut a morphological graph,
osm_buildings = osm_buildings.to_crs(epsg=27700)
osm_street_edges = osm_street_edges.to_crs(epsg=27700)
# Exclude rows with point geometries from osm_buildings
osm_buildings = osm_buildings[osm_buildings.geometry.type != "Point"]
# Define center point for the analysis area (Liverpool city centre)
center_point = gpd.GeoSeries([Point(-2.9879004, 53.4062724)], crs='EPSG:4326').to_crs(epsg=27700)

# Create the morphological graph
print("🏗️  Creating morphological graph...")
morpho_nodes, morpho_edges = c2g.morphological_graph(
    buildings_gdf=osm_buildings,
    segments_gdf=osm_street_edges,
    center_point=center_point,
    distance=500,                    # Analysis radius in meters
    clipping_buffer=300,            # Buffer for edge effects
    primary_barrier_col='barrier_geometry',
    contiguity="queen",             # Adjacency rule for tessellation
    keep_buildings=True,            # Preserve building geometries
    keep_segments=True,             # Preserve street segment geometries
)
🏗️ Creating morphological graph...
/Users/yutasato/Projects/Liverpool/city2graph/.venv/lib/python3.13/site-packages/libpysal/weights/contiguity.py:347: UserWarning: The weights matrix is not fully connected:
 There are 3 disconnected components.
 There are 2 islands with ids: 50_('way', 659554384), 50_('way', 659554386).
  W.__init__(self, neighbors, ids=ids, **kw)
print(f"   • Node types: {list(morpho_nodes.keys())}")
print(f"   • Edge types: {list(morpho_edges.keys())}")
print(f"   • Private spaces: {len(morpho_nodes['private']):,}")
print(f"   • Public spaces: {len(morpho_nodes['public']):,}")

for edge_type, edge_gdf in morpho_edges.items():
    print(f"   • {edge_type}: {len(edge_gdf):,} connections")
   • Node types: ['private', 'public']
   • Edge types: [('private', 'touched_to', 'private'), ('public', 'connected_to', 'public'), ('private', 'faced_to', 'public')]
   • Private spaces: 1,489
   • Public spaces: 651
   • ('private', 'touched_to', 'private'): 564 connections
   • ('public', 'connected_to', 'public'): 1,299 connections
   • ('private', 'faced_to', 'public'): 3,276 connections
fig, ax = plt.subplots(figsize=(14, 12), facecolor='#f9f9f9')

morpho_nodes["private"]["building_geometry"].plot(ax=ax, color='#e0e0e0', edgecolor='#c0c0c0', linewidth=0.3, alpha=0.7)
morpho_nodes["public"]["segment_geometry"].plot(ax=ax, color='#404040', linewidth=0.7, alpha=0.6)

c2g.plot_graph(
    nodes=morpho_nodes,
    edges=morpho_edges,
    subplots=False,
    ax=ax,
    bgcolor="#f9f9f9",
    labelcolor="#000000",
    node_color={'private': 'red', 'public': 'blue'},
    edge_color={
        ('private', 'touched_to', 'private'): '#B22222',
        ('public', 'connected_to', 'public'): '#0000FF',
        ('private', 'faced_to', 'public'): '#7B68EE',
    },
    markersize=10,
    linewidth=0.2,
)
<Axes: >

osm_hetero_data = c2g.gdf_to_pyg(morpho_nodes, morpho_edges)
osm_hetero_data
HeteroData(
  crs=EPSG:27700,
  graph_metadata=<city2graph.base.GraphMetadata object at 0x14bcc2270>,
  private={
    x=[1489, 0],
    pos=[1489, 2],
  },
  public={
    x=[651, 0],
    pos=[651, 2],
  },
  (private, touched_to, private)={
    edge_index=[2, 564],
    edge_attr=[564, 0],
  },
  (public, connected_to, public)={
    edge_index=[2, 1299],
    edge_attr=[1299, 0],
  },
  (private, faced_to, public)={
    edge_index=[2, 3276],
    edge_attr=[3276, 0],
  }
)